While your tests are running, you’ll be able to view live reports on open rates, click throughs, delivery metrics etc.
From any page in the console:
- Hover over ‘Engage’ and click on ‘Campaign Reports’.
- Select your campaign from the list.
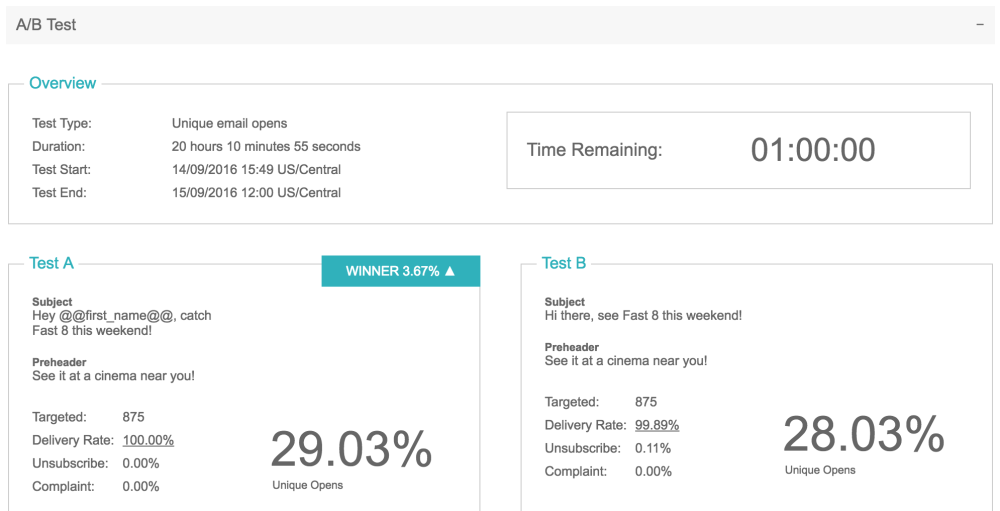
- Click on the ‘A/B Test’ header – the reporting will be broken into multiple sections.
- Overview – allows you to see metrics for each of your tests, and see which one is ‘winning’.
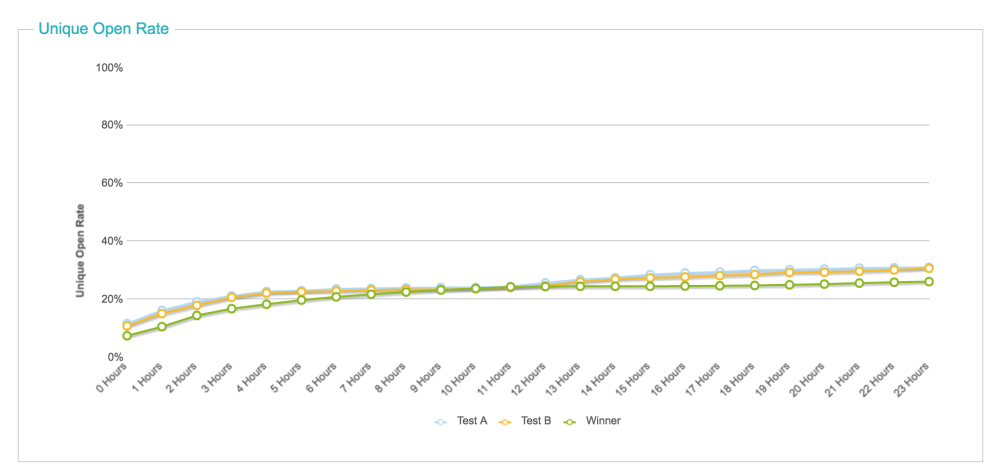
- Unique Open Rates/Click Through Rates – allows you to see a graph of how your campaign is performing throughout the test.
- Click on the ‘Interaction’ header in the reporting section. Here you’ll be able to view the combined delivery and interaction rates.
Comments
0 comments
Article is closed for comments.